In our last adventure, we assembled a team of brave stakeholders and hunted down a long, intimidating list of everything that could possibly go wrong with our product. Now, we’re standing before a whiteboard covered in sticky notes, each one representing a potential “dragon”—a quality risk lurking in our project. This list is both a triumph and a terror. It’s great that we’ve identified these threats, but looking at the sheer number of them can be overwhelming. Where do we even begin? Which of these dragons do we fight first?
This is where Quality Risk Assessment comes in. It’s the crucial next step where we move from “what if?” to “what now?” Risk assessment is the process of systematically sorting, categorizing, and prioritizing that chaotic list of risks. It’s how you transform a brainstorm into a strategic, actionable plan, ensuring you focus your energy on the threats that truly matter. This guide will walk you through how to size up your project’s dragons, from categorizing them to calculating a final risk level that will guide your entire testing effort.
The First Sort: Getting Organized
Before you can prioritize, you need to get organized. The first step in risk assessment is to categorize your identified risks. This helps bring clarity to your list and informs how you’ll eventually mitigate each item.
Product Risk vs. Project Risk
You’ll recall that risks generally fall into two buckets. It’s useful to separate them now:
- Product Risks: These are risks related to the quality of the product itself. Example: “The new search feature might return inaccurate results.”
- Project Risks: These are risks related to the success of the project. Example: “The key developer for the search feature might leave the company mid-project.”
While both are critical to address, risk-based testing is primarily a tool for mitigating product risks. Separating them allows the test team to focus on their area of influence while ensuring project risks are passed to the project manager to handle.
=> A Guide to Testing as Risk Mitigation
By Quality Characteristic
The next layer of organization is to tag each product risk with the quality characteristic it impacts. Is it a Performance risk? A Security risk? A Usability risk? A Functional risk? This categorization is incredibly helpful later. When you’re planning your performance tests, you can simply filter your list for all risks tagged with “Performance.”
=> A Practical Guide to Identifying Quality Risks
The Heart of the Matter: Calculating the Risk Level
Once your list is organized, you get to the core of the assessment. The goal is to assign a risk level to every item, which will tell you how much you should worry about it. The fundamental equation is simple:
Risk Level = Risk Likelihood × Risk Impact
In plain English:
- Risk Likelihood: How likely is this problem to actually happen?
- Risk Impact: If it does happen, how bad will the consequences be?
A problem that is very likely to occur and will cause catastrophic damage is a top-priority risk. A problem that is very unlikely and will be a minor annoyance is a low-priority risk. The rest of this guide is a deep dive into how you, as a team, can estimate these two critical factors.
Deep Dive: Gauging Risk Likelihood (“How Likely Is It?”)
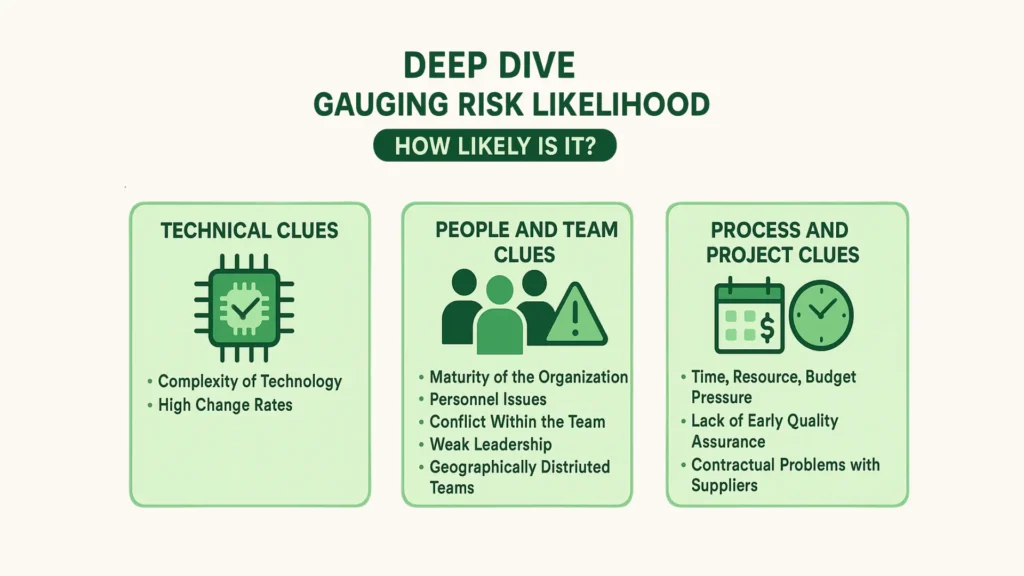
Estimating likelihood is like being a detective. You’re looking for clues in your project’s environment, team dynamics, and technology stack that suggest a higher or lower probability of failure. The source provides an excellent list of factors to consider. Let’s group them into themes.
Technical Clues
- Complexity of Technology, Tools, or System Architecture: A feature built on a brand-new, unproven technology or a feature that touches ten different microservices is inherently more likely to have bugs than a simple, self-contained component.
- High Change Rates: Constant churn in the requirements (test basis), the code itself, or the team members working on it increases the chances of miscommunication and error.
People and Team Clues
- Maturity of the Organization: A team that follows a mature, well-defined development process is less likely to make simple mistakes than one operating in a chaotic, unstructured way.
- Personnel Issues: A team with many junior developers (skills), a lack of key personnel (availability), low morale (motivation), or poor collaboration (autonomous working) is at higher risk. Deep knowledge of the Software Development Life Cycle (SDLC) in use is also key.
- Conflict Within the Team: When team members aren’t communicating well or are in active conflict, details get dropped, and bugs get introduced.
- Weak Managerial or Technical Leadership: A lack of clear direction or technical guidance can lead to inconsistent and poor-quality work.
- Geographically Distributed Teams: While common, distributed teams face inherent communication challenges that can increase the likelihood of misunderstandings.
Process and Project Clues
- Time, Resource, Budget, and Management Pressure: When a team is rushed, they cut corners. It’s a simple fact of life. Features developed under intense pressure are far more likely to contain defects.
- Lack of Early Quality Assurance Activities: If testing is an afterthought tacked on at the end, the likelihood of finding major issues late in the game is very high.
- Contractual Problems with Suppliers: If you rely on a third-party component and your relationship with that supplier is strained, the likelihood of getting timely support or fixes is low, increasing your risk.
Deep Dive: Measuring Risk Impact (“How Bad Will It Be?”)
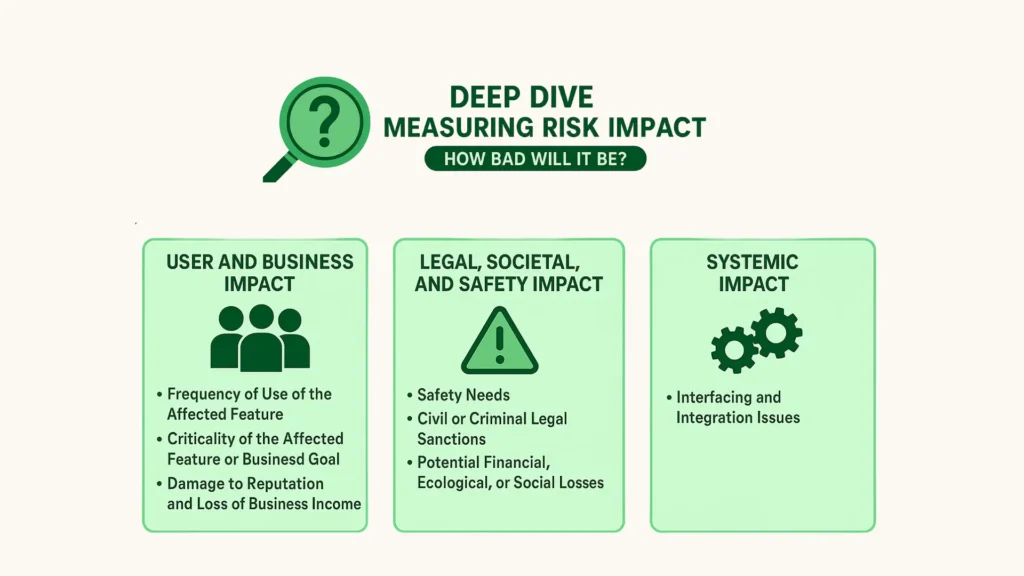
If estimating likelihood is like being a detective, measuring impact is like being an empath. You need to put yourself in the shoes of your users, your business, and your support team to understand the full consequences of a failure.
User and Business Impact
- Frequency of Use of the Affected Feature: A bug in the login page has a massive impact because 100% of your active users will encounter it. A bug in a rarely used admin setting has a much lower impact.
- Criticality of the Affected Feature or Business Goal: A failure in the “Complete Purchase” button is catastrophic because it directly affects revenue. A failure of the “Share to Social Media” button is less critical.
- Lack of Reasonable Workarounds: If the login page is broken and there is no other way for users to access their accounts, the impact is severe. If the PDF export is broken but users can still copy-paste the data, the impact is lessened by the workaround.
- Damage to Reputation and Loss of Business Income: These are the ultimate business impacts. Will this failure cause users to lose trust in your brand? Will it directly cause a drop in sales?
Legal, Societal, and Safety Impact
- Safety Needs: This is the highest level of impact. If you are working on software for a medical device, an airplane, or an autonomous vehicle, the impact of failure could be injury or loss of life.
- Civil or Criminal Legal Sanctions: Will this failure (e.g., a data breach) result in massive fines under regulations like GDPR or legal action against the company?
- Potential Financial, Ecological, or Social Losses: Could a bug in financial software cause people to lose their savings? Could a bug in industrial control software lead to an environmental disaster?
Systemic Impact
- Interfacing and Integration Issues: A bug in a core, centralized service (like an authentication or user profile service) has a huge blast radius. Its failure could cause a cascading failure across every other service that depends on it.
Putting It All Together: From Estimates to a Prioritized List
So, you’ve reviewed the factors and have a gut feeling for the likelihood and impact of each risk. How do you combine them into a final risk level? There are two main approaches.
The Rare Case: Quantitative Assessment
In a perfect world, you would have extensive and statistically valid risk data for everything. This is the quantitative approach. It’s a statistician’s dream but is rarely practical for most software teams.
- Example: You might have data showing there’s a 0.5% chance of a server outage during peak hours (risk likelihood), and each outage costs the business an average of $200,000 in lost sales (risk impact).
- Calculation: The risk level can be calculated as the product: 0.005 × $200,000 = $1,000. This $1,000 is the “risk exposure,” or the expected loss from this risk.
The Common Reality: Qualitative Assessment
Typically, you won’t have this kind of hard data. Your assessment will be qualitative, based on the stakeholders’ subjective perceptions of risk likelihood and risk impact. This is perfectly okay! The value is in the conversation and the shared agreement.
In this approach, you use ordinal scales—simple descriptive labels—to rate each factor. A common scale is Very High, High, Medium, Low, Very Low.
- Example: After discussing a risk related to a complex legacy component, the team agrees: “Given how old and brittle this code is, we rate the likelihood as High. Since it handles all user profile data, we rate the impact as Very High.”
The Risk Matrix: Your Prioritization Tool
Now, how do you combine a “High” and a “Very High”? You use a risk matrix. This is a simple grid that maps your likelihood and impact scales to produce a final, aggregate risk level.
| Very Low Impact | Low Impact | Medium Impact | High Impact | Very High Impact | |
| Very High Likelihood | Medium | High | High | Critical | Critical |
| High Likelihood | Low | Medium | High | High | Critical |
| Medium Likelihood | Low | Medium | Medium | High | High |
| Low Likelihood | Very Low | Low | Medium | Medium | High |
| Very Low Likelihood | Very Low | Very Low | Low | Low | Medium |
Looking at our example, we find the intersection of High Likelihood and Very High Impact on the matrix, which gives us an aggregate risk level of Critical. This final level is also a qualitative, relative rating. It’s not a number; it’s a priority label. After doing this for all your risks, you can simply sort your list by this final rating. Now you have a clear, prioritized list of your project’s dragons, from most to least scary.
=> Choosing the Right Test Management Tool
Conclusion
Risk assessment is the bridge between the chaos of “what if” and the clarity of “what’s next.” The process may seem subjective, and in many ways, it is. But its true power doesn’t come from achieving mathematical perfection. It comes from the collaborative process itself—the discussions, the debates, and the shared understanding that emerges when a diverse team comes together to think critically about quality.
By methodically categorizing your risks, evaluating their likelihood and impact using a wide range of factors, and combining them in a risk matrix, you create a powerful, data-informed, and defensible plan. You and your team now know exactly where to focus your precious time and energy. You know which dragons must be fought today, and which lizards can wait for another time. You are no longer just reacting; you are strategically protecting your product, your users, and your business from the threats that matter most.