
As a QA Manager, you’ve likely been in this meeting: you’re explaining a challenge your team is facing, describing a bottleneck, or arguing for more resources. You say something like, “I feel like our regression suite is getting too slow,” or “I think we’re finding too many bugs late in the cycle.” And then comes the question from a director or project manager: “What does the data say?”
That question can be daunting if you’re running on gut feelings and anecdotal evidence. But if you’re prepared, it’s the best question you can be asked. It’s an invitation to move the conversation from subjective opinion to objective fact. This is the entire premise of the analytical-based test process improvement approach.
While model-based approaches (like TMMi® or TPI NEXT®) are fantastic tools that help us compare our processes to external best practices, the analytical approach is about looking inward. It’s about using the rich data generated by your own team, on your own project, to identify problems and drive meaningful change. It’s how we, as quality leaders, graduate from saying “I think” to confidently stating, “I know.”
This approach isn’t about replacing our professional judgment; it’s about augmenting it with irrefutable evidence. Let’s explore how you can harness your project’s data to become a more effective, data-driven QA leader.
Why Your Data is Your Most Powerful Ally
In the world of quality assurance, our observations and experiences are invaluable. We often develop a sixth sense for where the risks in a project lie. However, qualitative assessments alone have their limits. They can be influenced by personal bias, recent events, or incomplete information. This can lead to recommendations that, while well-intentioned, are imprecise and difficult to defend.
Gain more insights about how to mitigate risks through testing with our article here: Fighting Dragons with a Plan: A Guide to Risk Mitigation Through Testing
This is where data analysis becomes our superpower. When you can walk into a meeting and say, “Our defect rejection rate has increased by 30% this quarter, primarily due to ‘environmental issues,’ which is costing us an estimated 40 developer-hours per sprint,” you’re no longer just sharing an opinion. You are presenting a business case.
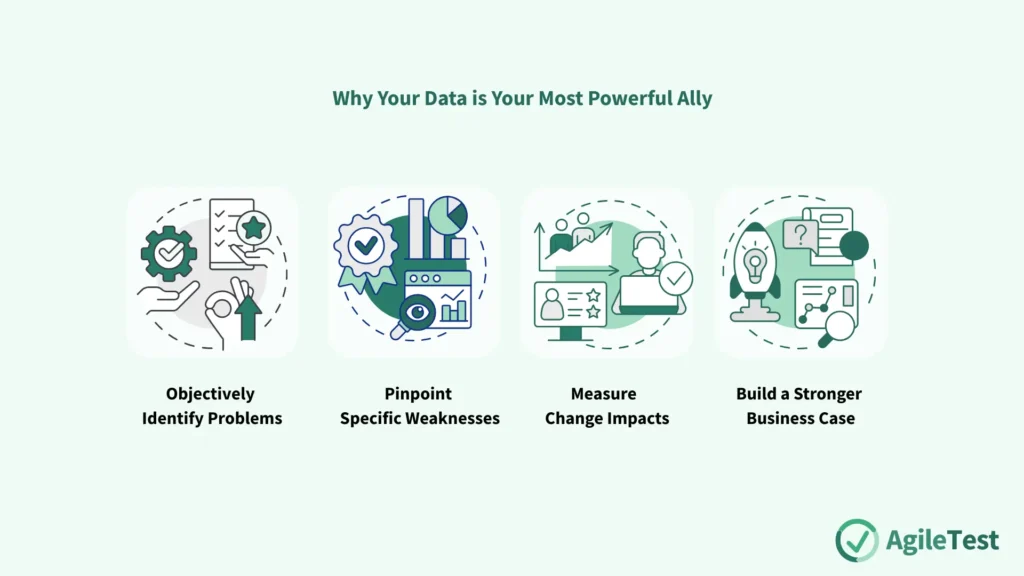
An analytical approach allows you to:
- Objectively Identify Problems: Data doesn’t have feelings. It will show you trends and correlations you might have missed.
- Pinpoint Specific Weaknesses: Instead of saying “testing is slow,” you can say, “the manual regression testing for our payment module takes 12 hours and has not found a critical defect in six months.”
- Measure the Impact of Changes: Did that new static analysis tool actually reduce the number of null pointer exceptions? Your data will tell you.
- Build a Stronger Business Case: A request for a new test automation engineer is much more compelling when it’s backed by data showing a clear ROI.
It’s also important to note that analytical and model-based approaches are not enemies; they are partners. You can use a model-based assessment to identify a potential area of weakness, and then use an analytical approach to verify the problem and quantify its impact.
Explore our related topic here: A Guide to Model-Based Test Process Improvement
Your Analytical Toolkit: Three Powerful Techniques
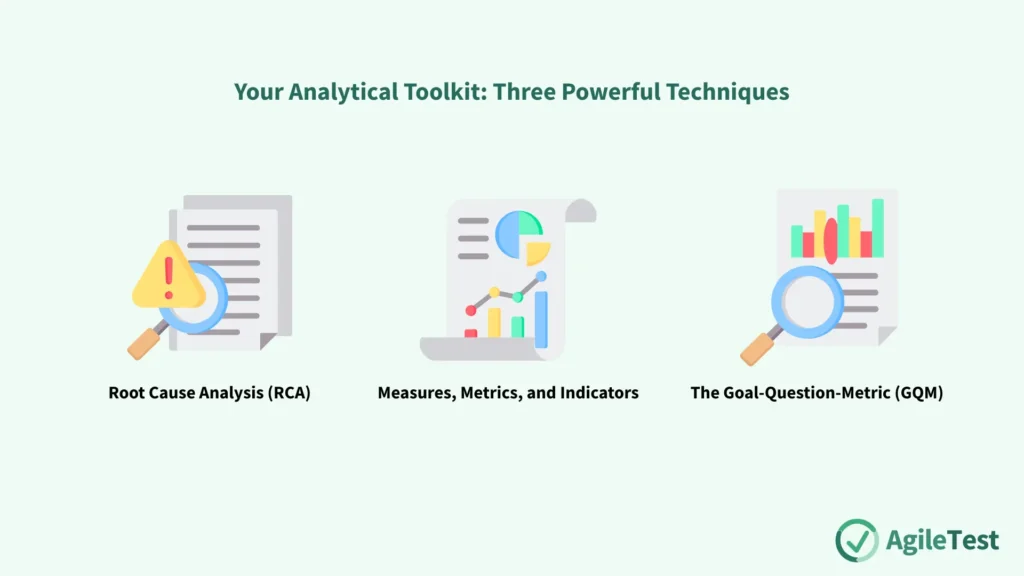
So, how do we actually do this? An analytical approach isn’t just about staring at a spreadsheet full of numbers. It involves using structured techniques to turn raw data into actionable intelligence. Let’s look at three of the most effective methods.
1. Root Cause Analysis (RCA): Playing Detective
Root cause analysis is the art of digging beneath the surface of a problem to find its true origin. It’s the difference between taking a painkiller for a recurring headache and going to the doctor to find out why you’re having them. Merely addressing the symptoms (the bugs) is a losing battle; you have to find and fix the underlying cause.
A classic and highly effective procedure for RCA involves:
- Select and Cluster Your Defects: You can’t analyze every single bug. Start with a meaningful dataset. A great place to begin is with all critical and major defects found in production over the last six months. Once you have them, look for clusters. Are many of them concentrated in a specific feature? Are they a particular type of error (e.g., security vulnerabilities, performance issues)?
- Unleash the Fishbone Diagram: For a significant defect cluster, the cause-effect diagram—also known as an Ishikawa or fishbone diagram—is your best friend. The “head” of the fish is the problem (e.g., “High number of API defects in production”). The “bones” of the skeleton are categories of potential causes. Common categories include:
- People: Lack of training, communication issues, inexperienced staff.
- Process: No code review process, poor requirements, inadequate test planning.
- Tools: Buggy IDE, misconfigured test environment, ineffective automation framework.
- Technology: Unstable third-party libraries, complex architecture.
- You and your team brainstorm potential causes within each category. This visual tool helps ensure you’re considering all angles.
- Derive Preventative Solutions: Once you’ve identified a likely root cause (e.g., “The development team lacks training on the new security protocol”), the solution becomes obvious. In this case, it’s not to tell the testers to “find more security bugs.” The real solution is to arrange for proper training. RCA allows you to shift from a reactive mode of finding defects to a proactive mode of preventing them.
2. Measures, Metrics, and Indicators: Building Your Quality Dashboard
To perform any kind of meaningful analysis, you need to be measuring the right things. These terms are often used interchangeably, but as managers, it’s useful for us to understand the distinction:
- A Measure is a raw, fundamental number (e.g., “We executed 450 test cases”).
- A Metric is a calculation derived from measures that gives context and allows for comparison (e.g., “Our test execution rate is 56 tests per person-day”).
- An Indicator is a metric that is tied to a goal and tells you at a glance if you’re on track (e.g., a green/yellow/red status light on your dashboard for the test execution rate).
Make use of AgileTest’s custom dashboard to manage and visualize key metrics in your report.
When deciding what to measure, focus on key attributes of your process. Three of the most important are:
- Effectiveness: Are we doing the right things? Are we finding the important bugs?
- Example Metric: Defect Detection Percentage (DDP). This is the percentage of bugs found by the test team before release, compared to the total number of bugs for that feature (those found pre- and post-release). A low DDP is a clear sign that your testing is not effective.
- Efficiency: How much effort does it take to do what we do?
- Example Metric: Cost Per Defect. This can be a simple calculation of the total hours spent on testing divided by the number of valid defects found. It helps you understand the cost-benefit of your testing activities.
- Predictability: Do we do what we say we will do? Can the business trust our estimates?
- Example Metric: Test Plan Accuracy. This compares the planned effort or duration for testing against the actual effort or duration. Consistently underestimating is a sign of a process problem.
By tracking a small, focused set of metrics related to these attributes, you can build a quality dashboard that gives you an objective, real-time view of your team’s performance and helps you spot negative trends before they become major problems.
Discover our guide on how to monitor and control test: Are We There Yet? A Practical Guide to Test Monitoring and Control
3. The Goal-Question-Metric (GQM) Approach: Measuring with a Purpose
The biggest trap in data analysis is collecting “vanity metrics”—data that looks interesting but doesn’t actually help you make a decision. The Goal-Question-Metric (GQM) approach is the perfect antidote. It’s a simple, top-down framework that ensures every piece of data you collect is tied directly to a stakeholder’s information need.
Here’s how it works:
- Start with the GOAL: First, define what you are trying to achieve or understand, from a specific stakeholder’s perspective. A good goal is specific and contextual.
- Example Goal: “Analyze the test automation process for the purpose of improving its efficiency from the perspective of the QA Manager in the context of the Mobile Banking project.”
- Ask clarifying QUESTIONS: Next, break that high-level goal down into a set of specific questions that, if answered, would satisfy the goal.
- Example Questions:
- “What is the current execution time of the automated regression suite?”
- “What is the failure rate of the automated tests?”
- “Which parts of the system have the lowest automation coverage?”
- Example Questions:
- Define the METRICS: Finally, identify the specific, measurable data points you need to collect to answer those questions.
- Example Metrics:
- “Execution time in minutes.”
- “Percentage of tests that passed vs. failed per run.”
- “Number of automated test cases per feature module.”
- Example Metrics:
By following this GQM structure, you guarantee that you’re not just collecting data for data’s sake. You are gathering targeted intelligence designed to answer specific, important questions that support your strategic goals.
Try AgileTest to strategize your test plan, manage your test data and execute them under various approaches.
Your Path Forward: From Theory to Action
As a manager, your role is to create an environment where quality can thrive. Embracing an analytical approach is one of the most impactful ways to do that. It equips you to lead with confidence, make decisions based on evidence, and communicate the value of your team in the language the business understands: data.
The journey starts small. You don’t need a complex business intelligence platform tomorrow. Pick one pain point that your team constantly talks about. Apply the GQM approach to frame the problem. Collect some simple metrics. Analyze what you find, perhaps using an RCA fishbone diagram.
You will be amazed at the clarity that emerges. The path to improvement will no longer be a matter of opinion, but a clear, data-driven strategy. You will have moved from “I think” to “I know,” and that is the foundation of exceptional quality leadership.