There’s a well-known saying in management: “What gets measured, gets done.” I’ve found this to be one of the most fundamental truths in software development. The flip side is just as powerful: what is not measured is not likely to be done, because it is incredibly easy to ignore. We can talk about quality, speed, and efficiency all day long, but without a way to measure these things, our conversations are just based on gut feelings and anecdotes.
This is where test metrics come in. They are the essential tools we use to bring clarity, objectivity, and data to the story of quality. For many teams, metrics can be a source of anxiety. Either they track nothing at all and are effectively flying blind, or they track dozens of “vanity metrics” and find themselves drowning in data without any real insight. The key is to find the right balance—to measure what truly matters.
At their core, metrics are the bridge between our actions and our goals. Our test objectives are the answer to why we test. Are we testing to improve performance? To ensure security? To validate new functionality? Test metrics are the indicators that help us answer the crucial follow-up question: “Did we succeed?” They are the scorekeepers that tell us if we are on track to meet our objectives.
This guide is about demystifying metrics. We’ll explore the three main categories of metrics, how to use them effectively throughout the testing lifecycle, and how they can transform your team’s conversations about quality from subjective debates into data-driven decisions.
The “What”: The Three Core Categories of Test Metrics
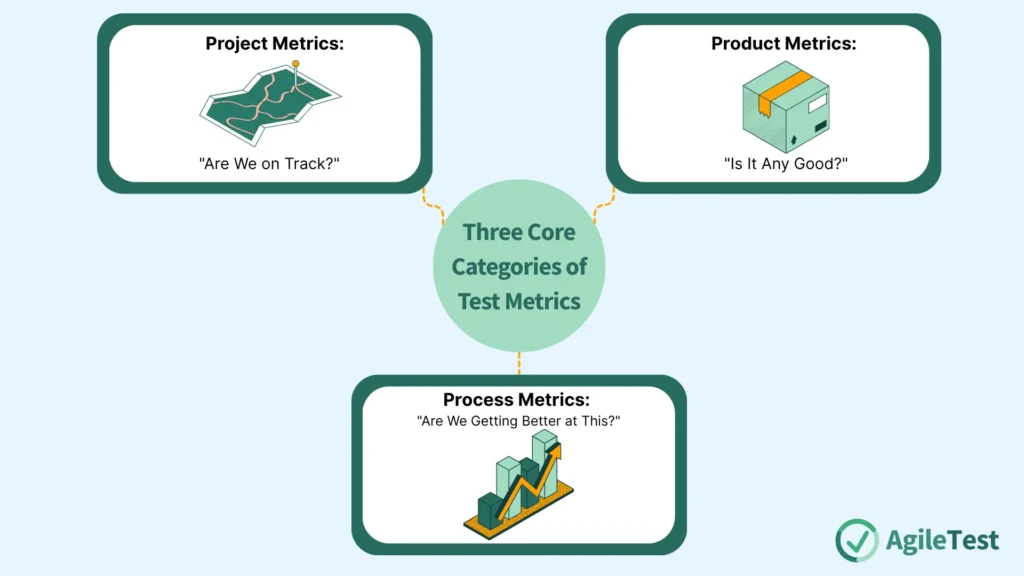
Not all metrics are created equal. To use them effectively, it helps to understand that they generally fall into one of three distinct categories. Each category answers a different kind of question about our work.
1. Project Metrics: “Are We on Track?”
Project metrics are all about the health and progress of the testing effort itself, measured against the project plan. They are the vital signs that help you answer questions related to schedule, budget, and scope. When a project manager asks, “Will testing be done on time?” or “Are we working on the things we planned to?”—project metrics provide the answer.
These metrics are essential for test monitoring and test control. They are the day-to-day numbers you watch to ensure the testing process isn’t falling behind or going off the rails.
Common Examples of Project Metrics:
- Percentage of Executed Test Cases: This is one of the most common metrics. You track the number of tests executed against the total number planned. It’s even more powerful when you break it down per status (e.g., passed, failed, blocked). A report showing “80% of tests executed” is good, but “80% executed, with 50% failing” tells a very different and more urgent story.
- Actual vs. Planned Effort: This tracks your team’s time. By comparing the actual vs. planned estimation (in hours) for testing activities, you can see if your initial estimates were accurate. If you consistently underestimate the time required, this metric provides the data needed to justify more realistic planning in the future.
- Actual vs. Planned Cost: For projects with a dedicated testing budget, tracking the actual vs. planned cost of testing is crucial for financial oversight and ensuring the project stays within its financial guardrails.
Project metrics are your navigational tools. They show you where you are on the project map and how fast you’re going, allowing you to make course corrections as needed.
2. Product Metrics: “Is It Any Good?”
While project metrics look at the process, product metrics look at the thing we’re actually building. They measure product attributes such as the degree to which the product meets the quality expectations of the intended users. These are the metrics that speak directly to the quality and readiness of the software. They help us answer the most important questions of all: “Is the product stable?” and “How risky would it be to release this right now?”
Common Examples of Product Metrics:
- Requirements Coverage: This metric tracks what percentage of the specified functional and non-functional requirements have a corresponding test case that has been executed and passed. It directly answers the question, “Have we tested everything we were asked to build?”
- Product Risk Coverage: In a risk-based testing approach, this is a vital metric. It measures what percentage of the identified product risks have been addressed by passing tests. It allows you to report on quality in terms of business risk, which is incredibly valuable for stakeholder communication.
- Code Coverage: This is a white-box testing metric, typically generated by tools during unit testing. It measures the percentage of the codebase’s lines, branches, or methods that are executed by the test suite. While a high percentage doesn’t guarantee quality, a low percentage in a critical area is a definite red flag.
- Defect Trends: A simple but powerful metric is tracking the accumulated number of resolved defects vs. the accumulated number of defects found over time. If the gap between “found” and “resolved” is growing, it’s a sign that the development team can’t keep up, and product stability is likely degrading.
Product metrics are your quality gauges. They give you a data-driven assessment of the software’s health, allowing you to make informed decisions about its readiness for release.
3. Process Metrics: “Are We Getting Better at This?”
The third category of metrics is all about introspection and continuous improvement. Process metrics measure the capability of the testing process and the effectiveness of testing. They help you look at your own work critically and identify areas for improvement. They answer questions like: “How efficient is our testing?” and “Where are the biggest bottlenecks in our quality process?”
Common Examples of Process Metrics:
- Defect Leakage: This measures the percentage of defects that were not found by the internal testing process and were instead discovered in production (either by users or by monitoring). A high defect leakage rate is a strong indicator that your testing process is not as effective as it needs to be.
- Test Case Effectiveness: This metric asks, “Of all the test cases we have, what percentage of them have actually found a defect?” A large suite of tests that rarely finds bugs might indicate that the tests are redundant, outdated, or not targeting the right areas.
- Automation Progress: For teams on an automation journey, tracking actual automated test cases vs. planned automated test cases is a key process metric. It shows whether the automation initiative is on track to meet its goals.
- Mean Time To Repair (MTTR): This measures the average time it takes from when a bug is reported until it is fixed, verified, and closed. A long MTTR can indicate bottlenecks in the handoff between testing and development, the deployment process, or the verification cycle.
Process metrics are your mirror. They reflect the health of your own ways of working and provide the insights you need to become a more efficient and effective team over time.
Explore the AgileTest report feature to sync your reports with details and reflect your testing health.
The “How”: Using Metrics Across the Test Lifecycle
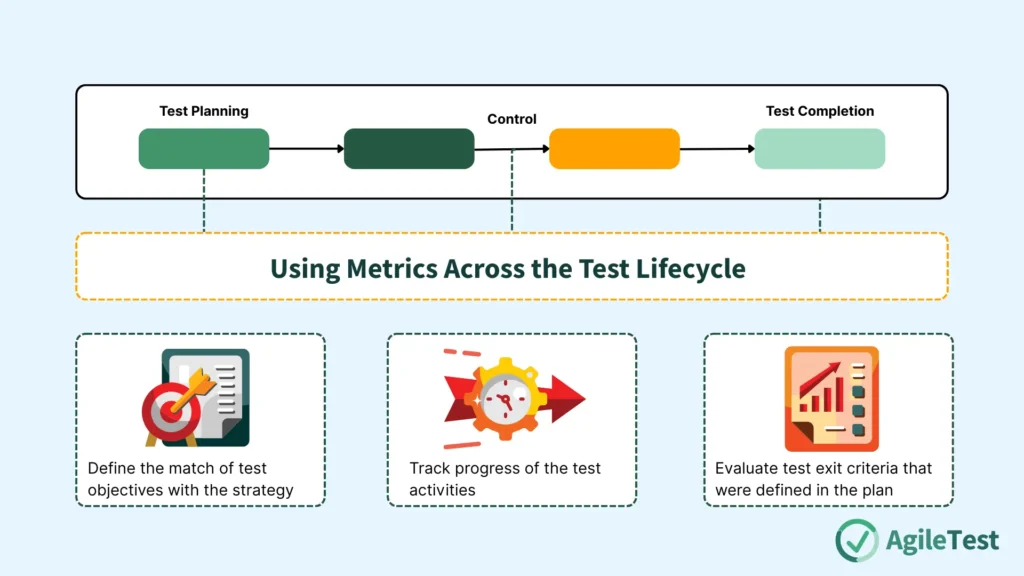
It’s not enough to just collect metrics; you have to use them. And how you use them changes depending on where you are in the project lifecycle. The metrics used during test monitoring and test control may be different from those used at test completion.
During Test Planning
The lifecycle of a metric begins here. During test planning, appropriate test metrics are defined that match the test objectives from the project test strategy. This is the crucial step of setting your targets before the race begins. You can’t know if you’ve succeeded if you haven’t first defined what success looks like. For example, if a primary objective for a release is to improve performance, your test plan should explicitly define the performance metrics you will track (e.g., “average API response time must be below 200ms under load”) and the targets you need to hit.
Understand how to conduct test planning effectively with our guide: Mastering Test Planning: Your Guide from Chaos to Clarity
During Test Monitoring and Test Control
Once testing is underway, the focus of your metrics shifts to tracking progress. During test monitoring and test control, the metrics are about the progress of the test activities. This is where you live and breathe your Project Metrics. You’re watching your test execution burndown charts, tracking the number of defects being opened versus closed, and making sure you are staying on schedule. If a metric shows a deviation from the plan—for example, a sudden spike in blocked test cases—it triggers a control action, like investigating the stability of the test environment.
Read our related guide about quality risk assessment here: Sizing Up the Dragons: A Practical Guide to Quality Risk Assessment
During Test Completion
At the end of a testing cycle, the conversation shifts again, from progress to final results. In test completion, the test objectives should be achieved. Your metrics are now used to evaluate whether you have met the test exit criteria that were defined in the plan. This is where your Product Metrics take center stage. You will present final reports on requirements coverage, product risk coverage, and the number of outstanding critical defects. Often, one or more metrics could be combined to measure test exit criteria. For example, an exit criterion might be: “98% of all planned tests must be executed AND 100% of critical tests must pass AND there can be no outstanding blocker defects.” This data provides the foundation for the final go/no-go release decision.
Learn more about test completion criteria with our article: From Chaos to Confidence: The Ultimate Guide to Test Completion Criteria.
A Practical Example: Putting It All Together
Let’s imagine your team is developing a new two-factor authentication (2FA) feature for your application.
- During Planning: The team establishes a key objective: “Ensure the 2FA feature is secure, reliable, and meets all functional requirements.” They define several metrics to measure this, including:
- Product Metric (for Exit Criteria): 100% test coverage of all security-related requirements from the OWASP ASVS standard.
- Project Metric (for Monitoring): Execute 100% of the 80 planned test cases for the feature.
- Process Metric (for Improvement): Successfully automate at least 25% of the new tests for inclusion in the regression suite.
- During Monitoring: Each day, the team tracks their test execution burndown chart. They notice after three days that the number of blocked tests is high. This metric triggers a conversation, and they discover that the SMS gateway for sending codes is unreliable in the test environment. They take a control action to prioritize fixing the environment.
- During Completion: At the end of the sprint, the final test report is generated. It shows: 100% of security requirements were tested and passed. 98% of all tests were executed (2 were descoped). 0 outstanding critical defects. 22 tests (27.5%) were successfully automated. Based on this clear, data-driven report, the stakeholders can confidently approve the release of the new feature
Install AgileTest, a unified tool with clear data for your test management process.
Conclusion
Metrics are the language we use to tell the objective story of quality. They move our conversations from “I feel like it’s a bit buggy” to “The defect density in this module is 40% higher than our average, which indicates a high level of risk.” This shift is transformative for any team.
Remember the saying we started with: “What gets measured, gets done.” Let’s add a new ending to it: What gets measured thoughtfully, gets improved. Metrics aren’t about creating bureaucracy or assigning blame. They are about providing visibility, fostering smart conversations, and guiding your team on a continuous journey toward building better products. By embracing the right set of project, product, and process metrics, you equip your team with the data it needs to navigate complexity, communicate with clarity, and deliver quality with confidence.