
Hey team,
Let’s grab a virtual coffee and talk about something that’s near and dear to my heart, something that can transform our QA practice from a simple “bug hunt” into a strategic, value-driving force for the entire organization. I’m talking about test reporting.
I know, I know. The mere mention of “reporting” can sometimes conjure images of tedious spreadsheets, endless data entry, and charts that nobody looks at. But I want you to shift that perspective. Think of yourself not just as a tester, but as a storyteller. Our data—the bugs we find, the tests we run, the risks we identify—tells a story. It’s the story of our product’s quality, our team’s progress, and the confidence with which we can go to market.
Effective test reporting isn’t about dumping raw numbers on someone’s desk. It’s about translating that data into actionable insights. It’s how we communicate our value, how we guide project decisions, and ultimately, how we champion quality from the first line of code to the final release. Over my years as a QA manager, I’ve seen good reporting align teams, avert disasters, and build incredible products. I’ve also seen poor reporting create confusion, mask critical issues, and lead to costly mistakes.
The goal of this guide is to demystify the process. We’ll walk through what to measure, why it matters, and how to present it in a way that’s clear, compelling, and drives action. So, let’s dive in and learn how to become master storytellers of quality.
Who Are We Talking To? Understanding Your Audience
Before you create a single chart or write a single summary, the first question you must ask is: “Who is this report for?” The metrics and level of detail that excite a fellow QA engineer will be very different from what a project manager or a C-level executive needs to know. Tailoring your message is the single most important rule of effective reporting.
Let’s break down the common audiences:
- The QA Team: This is your inner circle. They care about the nitty-gritty details. Reports for the team can include detailed defect logs, test case execution status, and specific technical challenges. The goal here is internal improvement: identifying bottlenecks, sharing knowledge, and coordinating daily efforts.
- The Development Team: Developers need clear, concise information to help them prioritize their work. They want to know which bugs are critical, where they were found, and how to reproduce them. Defect reports are key, but so are metrics that show defect trends in specific modules, which can help them spot systemic issues in their code.
- Project & Product Managers: These folks care about the bigger picture: schedule, budget, and scope. They need to know if the project is on track. Are we meeting our quality goals? Are there any major risks that could delay the release? They need high-level summaries, trend analysis, and a clear “red, yellow, green” status. They don’t need to know about every single bug, but they absolutely need to know about the ones that threaten the timeline or key features.
- Upper Management (VPs, C-Suite): This group is the 30,000-foot view. They have limited time and need to understand the business implications of your testing. Is the product ready for launch? What is the overall risk level? What is the return on investment for our quality efforts? Your report to them should be a concise, executive summary, focusing on risk, overall quality assessment, and the bottom line.
A single, one-size-fits-all report will fail to serve any of these audiences effectively. The best practice is to create different views or dashboards tailored to each group, all drawing from the same central set of data.
The Building Blocks: Key Metrics That Tell the Story
Now for the fun part. Let’s talk about the metrics themselves. These are the words and sentences of our story. I like to group them into categories that answer specific questions about our project.
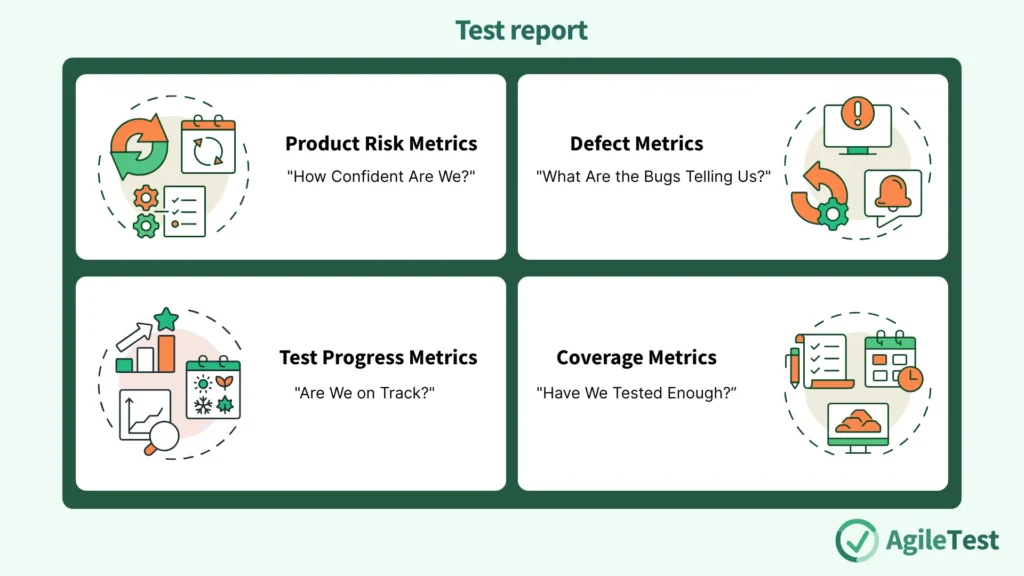
1. Product Risk Metrics: “How Confident Are We?”
At the end of the day, our job is to reduce risk. We want to find and eliminate the problems that could cause our customers pain, hurt our brand’s reputation, or impact revenue. Reporting on product risk is how we communicate our confidence level in the application.
- Percentage of Risks Covered by Tests: This metric links our testing directly to the business risks identified at the start of the project. If we’ve identified “data loss during transaction” as a critical risk, this metric shows how many tests we have specifically designed to try and trigger that failure.
- Percentage of Risks with Passed Tests: This is our confidence score. It answers: “Of the risks we’re worried about, how many have we tested successfully without finding any issues?” A high percentage here is a great sign.
- Percentage of Risks with Failed Tests: This is our action list. It highlights the areas where we have confirmed that a significant risk is, in fact, a reality. These are the areas that need immediate attention from the development team.
- Percentage of Risks Not Yet Tested: This is our “here be dragons” map. It shows the areas of the application we haven’t yet validated, representing the unknown. A large percentage here late in the cycle is a major red flag for any project manager.
In the Trenches: I remember a project where our dashboard showed that 90% of tests were passing. Management was ready to celebrate. But our risk report told a different story. The 10% of failing tests were all tied to the single biggest risk: the payment processing workflow. By presenting the risk metrics, we were able to shift the focus from a misleading “90% pass rate” to the critical issue that needed to be fixed before launch.
2. Defect Metrics: “What Are the Bugs Telling Us?”
Defects are the heart of QA reporting. But a simple count of “bugs found” is meaningless. The real value comes from slicing and dicing the defect data to uncover patterns and trends.
- Accumulated Defects (Opened vs. Closed): This is one of the most powerful graphs you can create. It’s a simple line chart showing the cumulative number of defects reported over time versus the cumulative number of defects resolved.
- If the lines are diverging (more bugs are being opened than closed), your team is falling behind. This is a clear signal that you need more development resources or need to slow down new feature development.
- If the lines are converging and starting to flatten, it’s a sign that the product is stabilizing. This is what you want to see as you approach a release.
- Defect Breakdown by…
- Priority/Severity: This is fundamental. It helps everyone prioritize. A report showing 100 open bugs is alarming. A report showing 1 critical, 5 major, and 94 minor bugs is manageable. It provides immediate focus.
- Test Item or Component: This tells you where the problems are concentrated. If the “User Profile” module has 50% of the open defects, you know that part of the codebase is fragile and may need refactoring. It helps developers focus their efforts.
- Source of Defect: Was the bug caused by a new feature or a regression (meaning, something that used to work is now broken)? A high number of regression defects can indicate issues with the development process, a lack of unit tests, or problems with code merges.
- Root Cause: This is a more advanced but incredibly valuable metric. It requires analysis to determine why the bug occurred in the first place. Was it a poorly written requirement? A misunderstanding of a use case? A simple coding error? Tracking root causes helps you fix your process, not just your code, preventing entire classes of bugs from happening in the future.
3. Test Progress Metrics: “Are We on Track?”
This category answers the simple, but vital, question that your project manager will ask you every single day: “Where are we at?”
- Test Execution Status: This is your daily scorecard. It’s a simple breakdown of all the tests you planned to run:
- Passed: The test ran successfully and the feature works as expected.
- Failed: The test ran, and we found a defect.
- Blocked: We couldn’t run the test, usually because of another defect or an environment issue. A high number of blocked tests is a major impediment and needs to be addressed quickly.
- Skipped: We intentionally decided not to run this test, perhaps because the feature was descoped.
- Not Yet Run: The tests that are still in the queue. This provides an immediate snapshot of progress and highlights any roadblocks.
- Test Effort: This is about tracking your team’s time. It’s the classic Actual vs. Planned comparison. Are we spending more hours on testing than we anticipated? If so, why? Is the code buggier than expected? Are the requirements unclear, causing us to rewrite tests? This metric is crucial for budget tracking and for planning future projects more accurately.
4. Coverage Metrics: “Have We Tested Enough?”
“Coverage” is a term that can be easily misunderstood. It’s not just about one number; it’s about looking at the product from different angles to see how much of it we’ve examined.
- Requirements Coverage: This is the most important coverage metric for higher-level testing (like System Testing or UAT). It answers: “For every requirement given to us by the business, do we have at least one test case to validate it?” This ensures we are building what the customer actually asked for. A gap here means a piece of functionality might be completely untested.
- Product Risk Coverage: We touched on this earlier, but it’s worth repeating. This maps your test cases directly to the identified product risks, ensuring your efforts are focused on what matters most.
- Code Coverage: This is a white-box metric, usually collected by developers from their unit tests, but it’s important for QA managers to understand. It measures what percentage of the application’s code (statements, branches, paths) is executed by the tests.
A Crucial Warning: It’s tempting to chase a 100% code coverage score. Don’t. Achieving 100% code coverage is often a waste of time and provides a false sense of security. A test can “cover” a line of code without actually verifying its logic is correct. More importantly, as the provided text wisely states, even with 100% component-level coverage, you can still have major defects at the integration or system level. Use code coverage as a guide to find completely untested parts of the application, but never as the sole measure of quality.
Read our article about test metrics here: Measuring What Matters: A Practical Guide to Test Metrics.
Bringing It All Together: The Art of the Dashboard and the Exit Report
Okay, we have our metrics. Now what? We need to weave them into a coherent story. This is where dashboards and summary reports come in.
The Power of the Dashboard
A good test dashboard provides a living, at-a-glance view of the project’s health. It should be tailored to its audience and combine metrics to tell a story. For a project manager, a great dashboard might include:
- A pie chart of Test Execution Status.
- The Accumulated Defects (Open vs. Closed) trend graph.
- A bar chart of Open Defects by Priority.
- A summary of Requirements Coverage percentage.
- A list of the Top 5 Blocking Issues.
This combination gives a comprehensive view in under 30 seconds. It shows progress, stability, priority, scope coverage, and immediate roadblocks.
Try the AgileTest custom dashboard feature to personalize your projects with built-in charts.
Deciding When to Stop: Exit Criteria and the Final Report
How do we know when we’re done testing? This should never be a gut feeling or simply when the calendar date arrives. The decision to stop testing should be data-driven, based on a set of pre-agreed conditions called Exit Criteria.
Your exit criteria might look something like this:
- 98% of all planned tests have been executed.
- 100% of all critical and major defects are closed.
- 95% of requirements have been covered by passed tests.
- The trend of open defects has been flat or declining for five consecutive days.
When your reporting shows that you have met these criteria, you can confidently recommend that the product is ready for release.
Refer to our guide about Test Completion Criteria here: From Chaos to Confidence: The Ultimate Guide to Test Completion Criteria.
Your final Test Summary Report (or Exit Report) is the final chapter of your story for that release. It summarizes the entire testing effort and provides a final quality assessment. It should include:
- A summary of the testing scope and objectives.
- A final breakdown of the metrics for test execution, defects, and coverage.
- A discussion of the residual risks—the known bugs or untested areas that will exist in the product upon release. No product is perfect, and being transparent about the remaining risks is crucial for business and support teams.
- Your final, professional recommendation: Go or No-Go for launch.
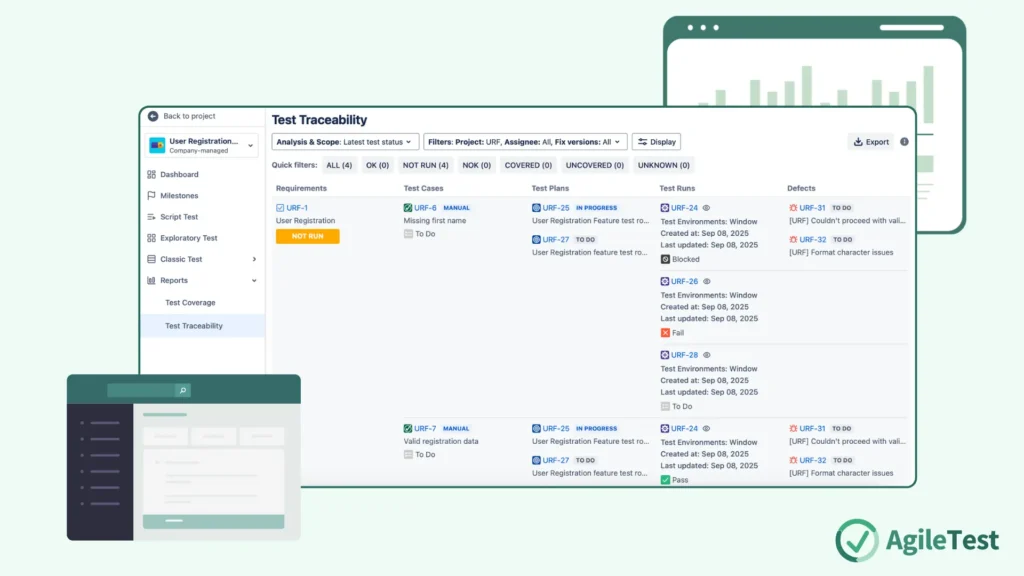
Install AgileTest to manage your test cases, prepare test sessions, and record them into your insightful reports.
Final Thoughts: Reporting as a Conversation
I want to leave you with this final thought: test reporting is not a one-way street. It’s not about us, the QA team, broadcasting numbers out into the void. It’s the start of a conversation.
When you show a chart of rising defects, the conversation is, “How can we support the development team to get these under control?” When you highlight a gap in requirements coverage, the conversation with the product manager is, “Is this feature still important, or have priorities shifted?” When you present the final summary report, the conversation with leadership is, “Are we, as a business, comfortable with the residual risk?”
Discover more about test control with our guide: Test Control: What’s all you should know about.
Your reports are your voice. They are the evidence you bring to the table to advocate for quality, to guide strategy, and to help your entire team build the best possible product. Embrace the role of the storyteller. Use your data to paint a clear picture, to guide your team, and to champion the cause of a job well done.